Regression Methods
FEF3001 Yapay zekaya giriş - Ders10
2024-12-12
ML types
- Classical ML
- Supervised
- Classification
- Regression
- Unsupervised
- Clustering
- Supervised
Contents
- Definition of regression
- Types of regression (linear, polynomial, and ensemble methods)
- Linear Regression: Simple Linear Regression, Ordinary Least Squares method, Evaluating model performance (R-squared, RMSE)
- Polynomial Regression: When to use polynomial regression, overfitting
- Regression with Random Forest: Random Forest algorithm for regression, Advantages (handling non-linearity, feature importance)
- Other types of regression: Logistic regression (for binary outcomes), Ridge and Lasso regression (regularization techniques)
- Examples on Excel
- Code examples in R and Python
Regression
Regression is a statistical method used in data analysis and machine learning to model and analyze the relationship between a dependent variable (often called the target or outcome variable) and one or more independent variables (also known as predictors or features). The primary goal of regression is to estimate how changes in the independent variables are associated with changes in the dependent variable, allowing for prediction and inference.
Key points about regression:
- It helps identify and quantify relationships between variables.
- It can be used for both prediction and understanding the impact of variables.
- There are various types of regression, including linear, polynomial, and more complex methods like Random Forest or Neural networks for regression.
- Regression models can handle both continuous and categorical variables.
- It’s widely used in many fields, including science, economics, and social sciences.
Linear Regression
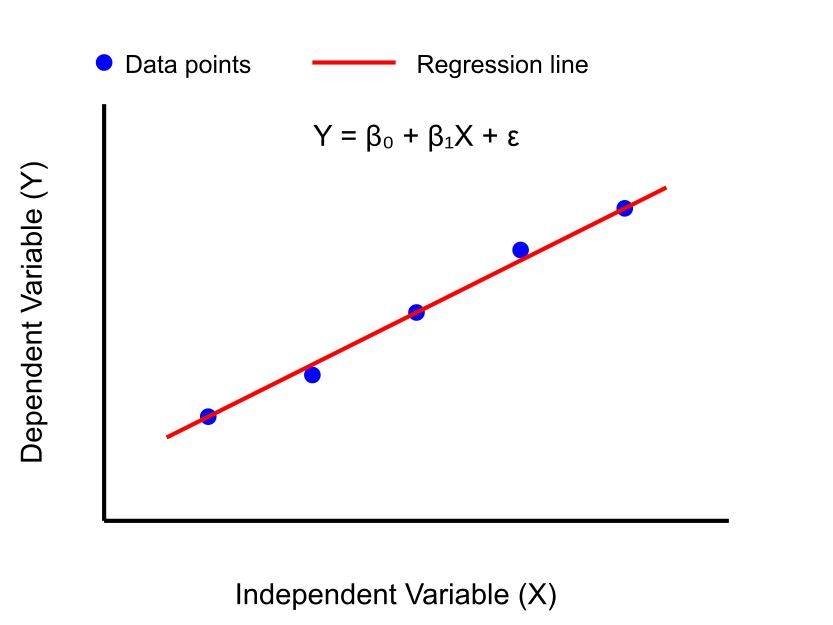
Linear Regression
Linear Regression
try finding the best line: https://www.geogebra.org/m/xC6zq7Zv
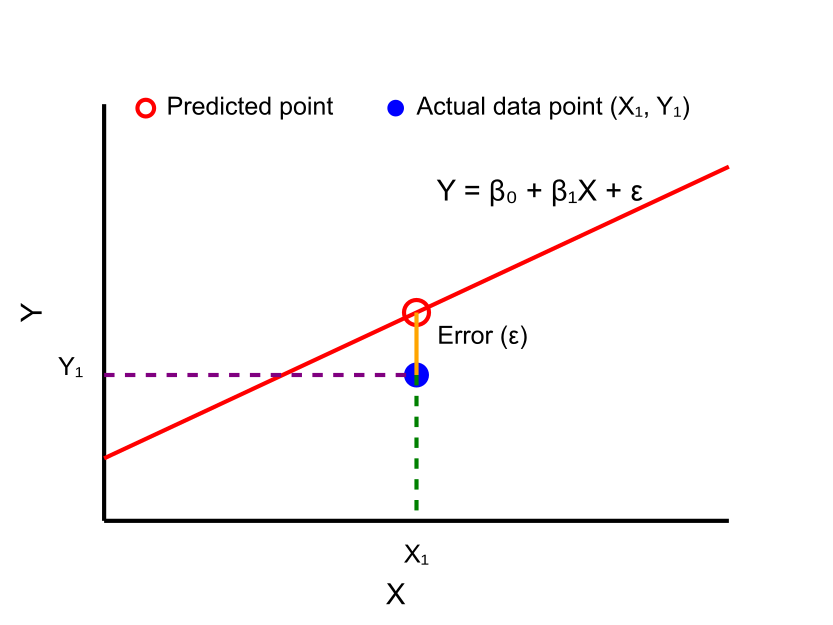
OLS method
Ordinary Least Squares (OLS) is a statistical method used to estimate the parameters of a linear regression model. It’s the most common technique for fitting a line to a set of data points in linear regression.
OLS is a method that minimizes the sum of the squared differences between the observed dependent variable values and the predicted values by the linear function of the independent variable(s). In other words, it finds the line (or hyperplane in multiple dimensions) that best fits the data by minimizing the sum of the squared residuals.
Please visit OLS Method at Wikipedia for technical details.
Multivariate Linear Regression
Multivariate Linear Regression, also known as Multiple Linear Regression, is a statistical method used to model the relationship between multiple independent variables and a single dependent variable. It extends the concept of simple linear regression to include more than one predictor variable.
The general form of the model is:
\[ y = \beta_0 + \beta_1x_1 + \beta_2x_2 + \ldots + \beta_nx_n + \varepsilon \]
Where:
y is the dependent variable, x₁, x₂, …, xₙ are the independent variables, β₀ is the y-intercept (the value of y when all x’s are zero), β₁, β₂, …, βₙ are the coefficients associated with each independent variable, n is the number of independent variables, ε is the error term
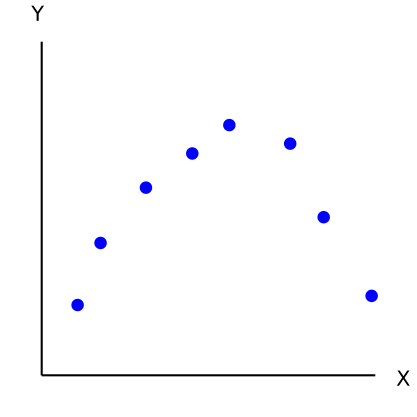
Polynomial Regression
Polynomial Regression is a form of regression analysis in which the relationship between the independent variable x and the dependent variable y is modeled as an nth degree polynomial. It’s used when the relationship between variables is not linear but can be approximated by a polynomial function.
\[ y = \beta_0 + \beta_1x + \beta_2x^2 + \beta_3x^3 + \ldots + \beta_nx^n + \varepsilon \]
Where:
y is the dependent variable, x is the independent variable, β₀, β₁, β₂, …, βₙ are the coefficients to be estimated, n is the degree of the polynomial and ε is the error term
Polynomial Regression
Linear Regression in Excel
Use MTCARS dataset Excel file and;
- draw Trendline between wt (weight) and mpg (miles per galon) columns.
- draw Trendline between disp (displacement) and wt (weight) columns.
Please visit MyExcelOnline in order see how to draw a Trendline in Excel

Linear Regression in R
Please refer to Linear Regression with R page for simple linear and polynomial regression.
Regression with Random Forest
Please refer to random forest regression with R document.