Clustering Methods
FEF3001 Yapay zekaya giriş - Ders11
2024-12-19
Contents
- Introduction to Clustering
- Definition and purpose, Unsupervised learning concept, Real-world applications in scientific fields
- Types of Clustering Algorithms
- Partitioning methods (e.g., K-means)
- Hierarchical methods
- Density-based methods (e.g., DBSCAN)
- K-means Clustering
- Algorithm explanation
- Choosing the number of clusters (elbow method)
- Advantages and limitations
- Hierarchical Clustering
- Agglomerative vs. divisive approaches
- Dendrogram interpretation
- Linkage methods (single, complete, average)
- Density-Based Spatial Clustering of Applications with Noise (DBSCAN)
- Core concepts: core points, border points, noise
- Algorithm explanation
- Advantages
- Evaluation Metrics for Clustering
- Silhouette score
Definition
Clustering is a technique in machine learning and data analysis that involves grouping a set of objects or data points in such a way that objects in the same group (called a cluster) are more similar to each other than to those in other groups. It’s a fundamental task in many data analysis and pattern recognition problems.
Purpose
The purpose of clustering is multifaceted:
Pattern Discovery: Clustering helps in identifying inherent patterns or structures within data that might not be immediately apparent.
Data Summarization: It can be used to compress large datasets by representing many data points with fewer cluster centroids.
Anomaly Detection: By identifying groups of similar data points, clustering can help in spotting outliers or anomalies that don’t fit into any cluster.
Segmentation: In fields like marketing, clustering is used to segment customers into groups with similar behaviors or characteristics.
Preprocessing for Other Algorithms: Clustering can be used as a preprocessing step for other algorithms, reducing the complexity of the data.
Natural Classification: In scientific fields, clustering can reveal natural groupings in data, such as in biology for grouping similar species or in astronomy for categorizing types of stars.
Clustering Methods
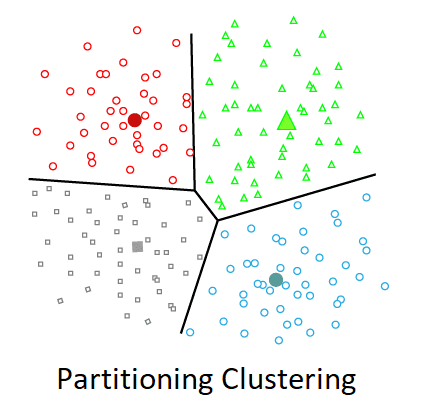
Partitioning methods: Divide data into non-overlapping subsets, with each data point belonging to exactly one cluster, often optimizing a specific criterion.
Hierarchical Methods: Create a tree-like structure of clusters, either by merging smaller clusters into larger ones or dividing larger clusters into smaller ones.
Density-based Methods: Form clusters in areas of high data point density, separated by regions of low density, allowing for discovery of arbitrarily shaped clusters.
Applications
- Biology
- Gene Expression Analysis: Grouping genes with similar expression patterns across different conditions or time points.
- Species Classification: Clustering organisms based on genetic or morphological features.
- Protein Structure Analysis: Identifying structural motifs in proteins.
- Chemistry
- Molecular Dynamics: Analyzing conformations of molecules during simulations.
- Spectroscopy: Clustering similar spectra for compound identification.
- Drug Discovery: Grouping chemical compounds with similar properties or effects.
- Physics
- Particle Physics: Classifying particle collision events in high-energy physics experiments.
- Astrophysics: Clustering stars or galaxies based on their properties (e.g., luminosity, temperature).
- Materials Science: Analyzing crystal structures and defects in materials.
Partitioning
K-means clustering
K-means clustering is an unsupervised machine learning algorithm used to group similar data points into clusters. It works by iteratively assigning data points to k predefined clusters based on their similarity to the cluster centers (centroids). The algorithm starts by randomly initializing k centroids in the feature space. It then repeatedly performs two steps:
- assign each data point to the nearest centroid, and
- recalculate the centroids as the mean of all points in each cluster.
This process continues until the centroids stabilize or a maximum number of iterations is reached. K-means aims to minimize the within-cluster sum of squares, resulting in compact and distinct clusters.
K-means clustering - interactive demos
Please visit the following sites:
K-means clustering with R
Please visit K-means with R page for the code.
Advantages of K-means clustering
- Simplicity: Easy to understand and implement.
- Efficiency: Generally fast and computationally efficient, especially for large datasets.
- Scalability: Works well with high-dimensional data.
- Flexibility: Can be adapted to different types of data with appropriate distance metrics.
- Interpretability: Resulting clusters are often easy to interpret.
Disadvantages of K-means clustering
- Sensitivity to initial centroids: Results can vary based on the initial random placement of centroids.
- Requires predefined k: The number of clusters must be specified beforehand, which isn’t always known.
- Assumes spherical clusters: Performs poorly with non-globular cluster shapes.
- Sensitivity to outliers: Outliers can significantly impact centroid calculation and cluster assignment.
- Struggles with varying cluster sizes: Tends to create clusters of similar spatial extent.
- Local optima: May converge to a local minimum rather than the global optimum.
- Inability to handle categorical data directly: Requires preprocessing for non-numerical data.
Hierarchical clustering
Hierarchical clustering is an unsupervised machine learning technique used to group similar data points into clusters. Unlike other clustering methods that require a predefined number of clusters, hierarchical clustering creates a tree-like structure of clusters called a dendrogram. This method works by either starting with each data point as its own cluster and iteratively merging the closest clusters (agglomerative approach), or by starting with all data points in one cluster and recursively dividing it (divisive approach). The process continues until a stopping criterion is met, such as a desired number of clusters or a threshold distance between clusters.
Hierarchical clustering is particularly useful for exploring the inherent structure of data at different levels of granularity and for datasets where the number of clusters is not known in advance.
How it works
Hierarchical clustering begins by calculating the distances between all pairs of data points using a chosen distance metric (e.g., Euclidean distance). In the agglomerative approach, which is more common, each data point starts as its own cluster. The algorithm then iteratively merges the two closest clusters based on a linkage criterion (e.g., single linkage, complete linkage, or average linkage). This process repeats, forming larger clusters until all data points are in a single cluster or until the desired number of clusters is reached. The result is a hierarchical structure that can be visualized as a dendrogram, allowing users to choose the level of clustering that best suits their needs.
Please visit Hierarchical Clustering in Data Mining and An Introduction to Hierarchical Clustering
Please visit following sites for demos
Advantages of hierarchical clustering
No predefined number of clusters required: Unlike k-means, hierarchical clustering doesn’t require specifying the number of clusters in advance.
Hierarchical representation: Provides a dendrogram, offering insights into the data structure at different levels.
Flexibility in cluster granularity: Users can choose the level of clustering that best suits their needs by cutting the dendrogram at different levels.
Applicability to various data types: Can be applied to any data type for which a similarity or distance measure can be defined.
Interpretability: The dendrogram provides a visually intuitive representation of the clustering process.
Handles different cluster shapes: Can identify clusters of various shapes and sizes, not just spherical ones.
Disadvantages
Computational complexity: O(n^2) space complexity and O(n^3) time complexity in many implementations, making it less suitable for very large datasets.
Sensitivity to noise and outliers: Outliers can significantly affect the shape of the dendrogram.
Difficulty in handling high-dimensional data: Performance and interpretability may decrease as the number of dimensions increases.
Lack of backtracking: Once a merge or split is made, it can’t be undone, which may lead to suboptimal results.
Memory intensive: Storing the distance matrix for large datasets can be memory-intensive.
Choice of distance metric and linkage method: Results can vary significantly based on the chosen distance metric and linkage method, requiring careful consideration.
Scalability issues: Not as scalable as some other clustering methods for very large datasets.
DBSCAN clustering
DBSCAN (Density-Based Spatial Clustering of Applications with Noise) is a popular clustering algorithm that groups together points that are closely packed in space, marking points that lie alone in low-density regions as outliers.
It works by selecting a random unvisited point and exploring its neighborhood within a specified radius (ε). If this neighborhood contains a minimum number of points (MinPts), a cluster is formed. The algorithm then iteratively expands the cluster by exploring the neighborhoods of the newly added points. If a point doesn’t have enough neighbors to form a cluster, it’s labeled as noise. This process continues until all points have been visited, resulting in a set of dense clusters of varying shapes and sizes, along with identified noise points.
Interactive demos
Please visit DBSCAN— A visualized and detailed introduction page about core concepts
Please visit Visualizing DBSCAN Clustering page for interactive demo for DBSCAN algoritm
DBSCAN Algoritm
Advantages of DBSCAN
- Shape flexibility: Can find arbitrarily shaped clusters, not just circular ones.
- Outlier detection: Automatically identifies noise points and outliers.
- No pre-defined number of clusters: Unlike k-means, doesn’t require specifying the number of clusters beforehand.
- Density-based: Effective at separating clusters of different densities.
- Robustness: Less sensitive to outliers compared to centroid-based algorithms.
Disadvantages
- Parameter sensitivity: Results can vary significantly based on the choice of ε and MinPts parameters.
- Struggle with varying densities: May have difficulty when clusters have widely different densities.
- High-dimensional data: Performance and effectiveness can decrease in high-dimensional spaces due to the “curse of dimensionality”.
- Memory requirements: Can be memory-intensive for large datasets.
- Scalability: Not as efficient for very large datasets compared to some other algorithms.
- Connectivity-based: May struggle with datasets where clusters are close but separated by sparse areas.
Evaluating clustering
Definition: The silhouette score ranges from -1 to 1, where:
- A score close to 1 indicates that the data point is well-matched to its own cluster and poorly-matched to neighboring clusters.
- A score around 0 suggests that the data point is on or very close to the decision boundary between two neighboring clusters.
- A negative score indicates that the data point might have been assigned to the wrong cluster.
Calculation: For each data point i, the silhouette score s(i) is calculated as:
s(i) = (b(i) - a(i)) / max(a(i), b(i))
Where: a(i) is the average distance between i and all other points in the same clusteri, (i) is the average distance between i and all points in the nearest cluster that i is not a part of
Interpretation:
- Higher silhouette scores indicate better-defined clusters.
- The average silhouette score across all points can be used to compare different clustering configurations.
Classification vs. Clustering
please compare these two concepts